Gap Inc.’s comparable sales for the first quarter of fiscal year 2016 were down 5 percent versus a 4 percent decrease last year. Comparable sales by global brand for the first quarter were as follows:
-
Gap Global: negative 3 percent versus negative 10 percent last year
-
Banana Republic Global: negative 11 percent versus negative 8 percent last year
-
Old Navy Global: negative 6 percent versus positive 3 percent last year
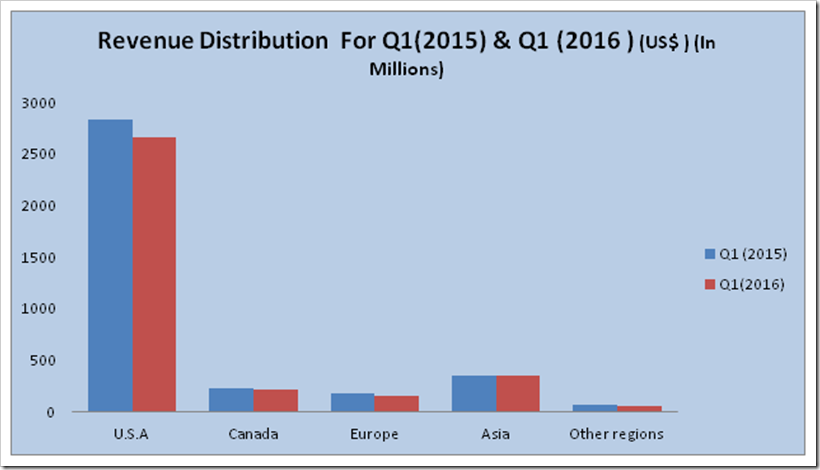
Net sales for the first quarter of fiscal year 2016 were $3.44 billion compared with $3.66 billion for the first quarter of fiscal year 2015. The translation of foreign currencies into U.S. dollars negatively impacted the company’s reported net sales for the first quarter of fiscal year 2016 by about $20 million. In calculating the net sales change on a constant currency basis, current year foreign exchange rates are applied to both current year and prior year net sales. This is done to enhance the visibility of underlying sales trends, excluding the impact of foreign currency exchange rate fluctuations. So far as the demographic distribution of revenue is concerned , USA still leading the charts with 77.31% share in the total revenue however in the quarter 1 of 2015 , the USA accounted 82% share . Old Navy contributed the highest share in the revenue with 43% while the Gap Global and Banana Republic Global contributed 36% and 16% respectively in the Quarter 1 ,2016
The following table details the company’s first quarter fiscal year 2016 net sales:
|
US$(In Millions) |
||||||
|
Regions |
Gap Global |
Old Navy Global |
Banana Republic Global |
Other |
Total |
% of Net Sales |
|
U.S.A |
698 |
1,328 |
454 |
178 |
2658 |
77.31% |
|
Canada |
70 |
98 |
47 |
1 |
216 |
6.28% |
|
Europe |
144 |
0 |
14 |
0 |
158 |
4.60% |
|
Asia |
280 |
50 |
26 |
0 |
356 |
10.35% |
|
Other regions |
31 |
10 |
9 |
0 |
50 |
1.45% |
|
Total |
1223 |
1486 |
550 |
179 |
3438 |
100.00% |
|
US$ (In Millions) |
||
|
Regions |
Q1 (2015) |
Q1(2016) |
|
U.S.A |
2828 |
2658 |
|
Canada |
224 |
216 |
|
Europe |
181 |
158 |
|
Asia |
355 |
356 |
|
Other regions |
69 |
50 |
|
Total |
3657 |
3438 |
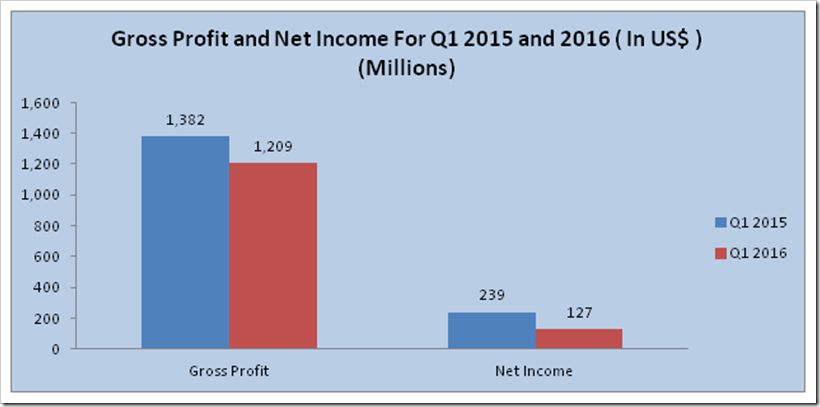
The most distressing figure is its net income ,which fell down to US$ 127 Million from US$ 239 and it is due to rise in the operating as well as as the non operating expenses. The company needs to seriously look in to its cost management as well as in its distribution in order to present a healthy financials. Gap Inc.’s first quarter fiscal year 2016 diluted earnings per share were US$0.32 against US$0.56 in 2015.
|
US$ (In Millions) |
||
|
Particulars |
Gross Profit |
Net Income |
|
Q1 2015 |
1,382 |
239 |
|
Q1 2016 |
1,209 |
127 |
Restructuring
In an effort to control its costs and improve profitability,the clothing retailer will close its fleet of 53 Old Navy stores in Japan. All in all it will be closing 75 stores in an effort to save $275 million annually. As part of this restructuring, Old Navy will close stores in Japan and focus on growth in North America and China. The brand saw a 6 percent global same-store sales decline in the quarter. Gap emphasized that Japan remains an important market for the company’s portfolio and that 200 Gap and Banana Republic stores will remain in the country.
Many of Gap’s problems are those facing other retailers as well, analysts said. Shoppers are reluctant to spend on clothing, and many aren’t rushing to the mall — this time of year is particularly slow for retailers. Macy’s, Kohl’s and Nordstrom all reported disappointing first-quarter results. Also Gap never evolved beyond its reputation as a place for clean-cut basics. While other retailers such as J. Crew and Urban Outfitters updated their aesthetic to keep up with changing times, Gap never successfully managed to modernize. And this is justified by the fact that Gap shares are down more than 50 per cent since the beginning of 2015.


