Swedish Fashion Retailer – H&M’s sales increased by 3% to USD 19,669 Million (SEK 178,817 m) during the first nine months of the financial year .However during the Q3 , the sales increased by 9% to USD 7128 million (SEK 64,800 m) . The ongoing transition has contributed to gradually improved sales and increased market share in most markets. The group’s online sales increased by 32 percent and currently the group has 4,841 (4,553) stores as of 31 August 2018, of which 247 (209) were operated by franchise partners.
“The rapid changes in the fashion industry are continuing and the H&M group is in an exciting transitional period. Our transformation work has contributed to a gradual improvement in sales development with increased market share in most markets during the third quarter, particularly in Germany, Sweden, Eastern Europe, Russia and China, said -Karl-Johan Persson, CEO
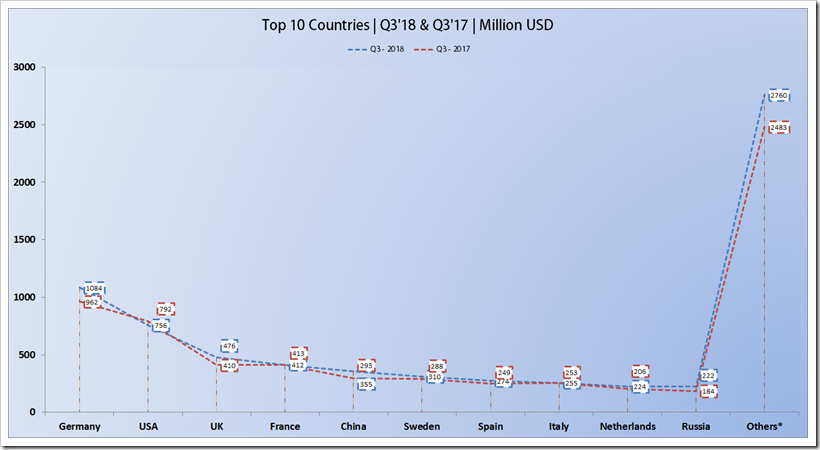
Top 10 Countries Based On Sales For The Q3’18
Germany is the biggest revenue generator country for H&M during Q3 and had contributed USD 1084 million to the total sales of H&M and also managed to register a growth of 13% from the previous year’s quarter. USA dissapointed with its adverse growth rate , though it is the 2nd largest contributor however the performance is not that good. China and Russia seemed to be the fastest growing spot for the H&M as in the top 10 list , China marked a growth rate of 21% during Q3 along with Russia . UK, being the 3rd largest contributor with USD 476 million during the Q3 , had a growth rate of 16% during the 3rd quarter of 2018 .
|
Regions |
Q3 – 2018 (SEK M) |
Q3 – 2017 (SEK M) |
Q3 – 2018 (USD M) |
Q3 – 2017 (USD M) |
Change in % |
31 Aug – 18 No Of Stores |
|
Germany |
9,851 |
8,748 |
1084 |
962 |
13% |
458 |
|
USA |
6,869 |
7,198 |
756 |
792 |
-5% |
559 |
|
UK |
4,330 |
3,726 |
476 |
410 |
16% |
294 |
|
France |
3,749 |
3,752 |
412 |
413 |
0% |
240 |
|
China |
3,225 |
2,660 |
355 |
293 |
21% |
522 |
|
Sweden |
2,821 |
2,619 |
310 |
288 |
8% |
168 |
|
Spain |
2,490 |
2,265 |
274 |
249 |
10% |
173 |
|
Italy |
2,319 |
2,301 |
255 |
253 |
1% |
175 |
|
Netherlands |
2,038 |
1,873 |
224 |
206 |
9% |
143 |
|
Russia |
2,015 |
1,671 |
222 |
184 |
21% |
137 |
|
Others* |
25,093 |
22,570 |
2760 |
2483 |
11% |
1972 |
|
Total |
64,800 |
59,383 |
7128 |
6532 |
9% |
4841 |
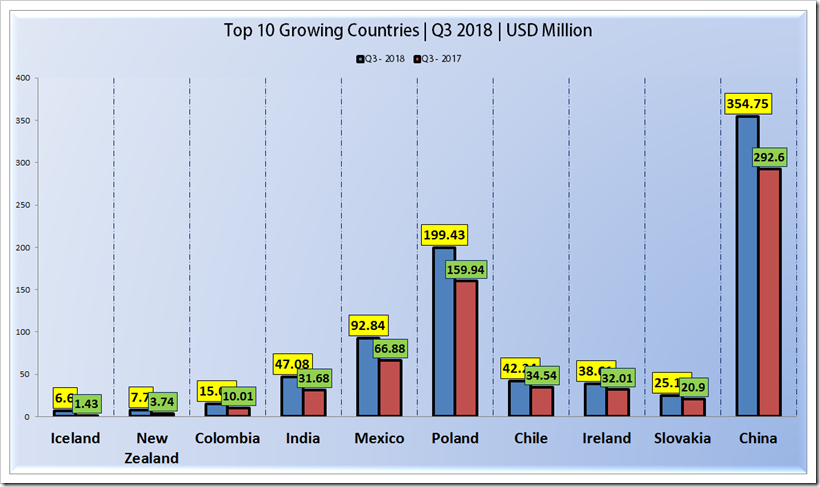
Top 10 Growing Countries Based On Sales Of The Quarter Ended On August 31,2018
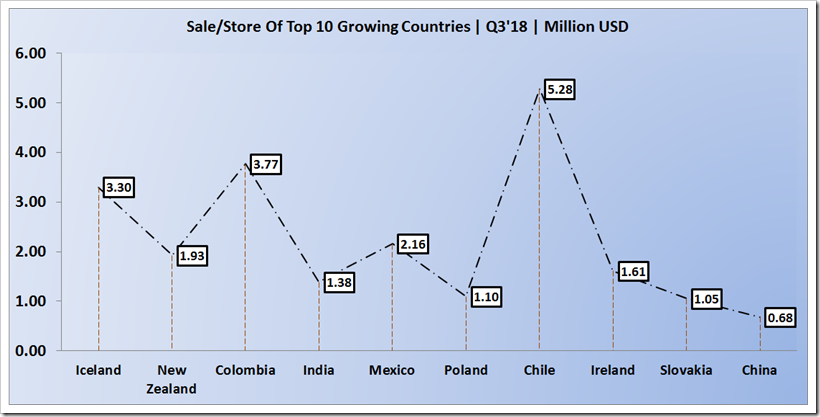
This table presents the ranking of top 10 countries which have grown the most in terms of Sales during the Q3 of 2018 . Iceland surprises the list with Rank 1 with a growth rate of 362% (however it has only 2 stores) followed by New Zealand with 106%. The number of stores as on Aug 31,2018 for both the countries were 2 and 4 respectively and the sale/store were USD 3.30 million and 1.93 Million respectively. The highest sale/store was found in Chile which had USD 5.28 Million sale per store with 8 stores only . Chile is growing at 22% . There are two countries from South East Asia in the list – India and China . For Q3 , India grew at a rate of 49% with 34 stores in hand and the total sales for Q3 was USD 47.08 million ( USD 1.38 million / Store) however China , which has 522 stores as on August 31 , managed to draw sales of USD 0.68 million per store.
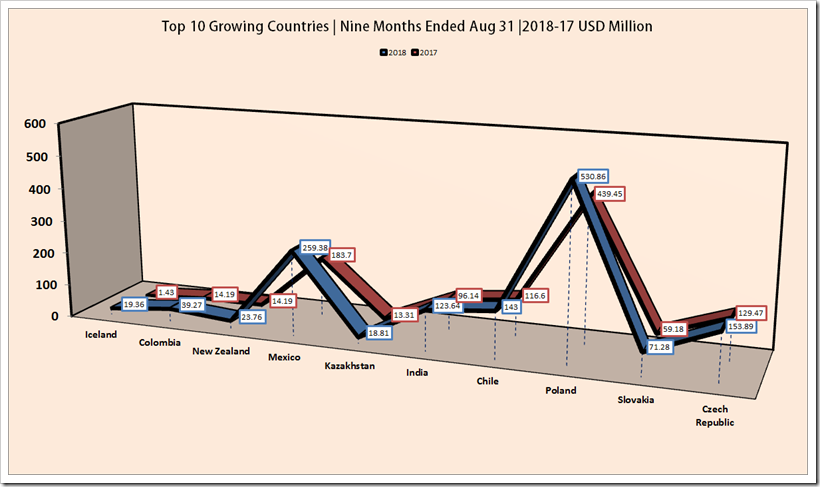
If we compare the sales figures of nine months , India marked the growth rate of 29% and the per store sales were then USD 3.64 million . The per store/month sales comes to about $0.4 million for India against China’s $0.23 million . Its growth rate is the highest if we consider a reasonable number of stores (ie about 25) . But we need to consider that China is growing at a bigger base of over 500 stores and hence its growth rate of 21% is also appreciable.
|
Regions |
Q3 – 2018 (SEK M) |
Q3 – 2017 (SEK M) |
Q3 – 2018 (USD M) |
Q3 – 2017 (USD M) |
Change in % |
31 Aug – 18 No Of Stores |
Sale/Store |
|
Iceland |
60 |
13 |
6.6 |
1.43 |
362% |
2 |
3.30 |
|
New Zealand |
70 |
34 |
7.7 |
3.74 |
106% |
4 |
1.93 |
|
Colombia |
137 |
91 |
15.07 |
10.01 |
51% |
4 |
3.77 |
|
India |
428 |
288 |
47.08 |
31.68 |
49% |
34 |
1.38 |
|
Mexico |
844 |
608 |
92.84 |
66.88 |
39% |
43 |
2.16 |
|
Poland |
1,813 |
1,454 |
199.43 |
159.94 |
25% |
182 |
1.10 |
|
Chile |
384 |
314 |
42.24 |
34.54 |
22% |
8 |
5.28 |
|
Ireland |
351 |
291 |
38.61 |
32.01 |
21% |
24 |
1.61 |
|
Slovakia |
229 |
190 |
25.19 |
20.9 |
21% |
24 |
1.05 |
|
China |
3,225 |
2,660 |
354.75 |
292.6 |
21% |
522 |
0.68 |
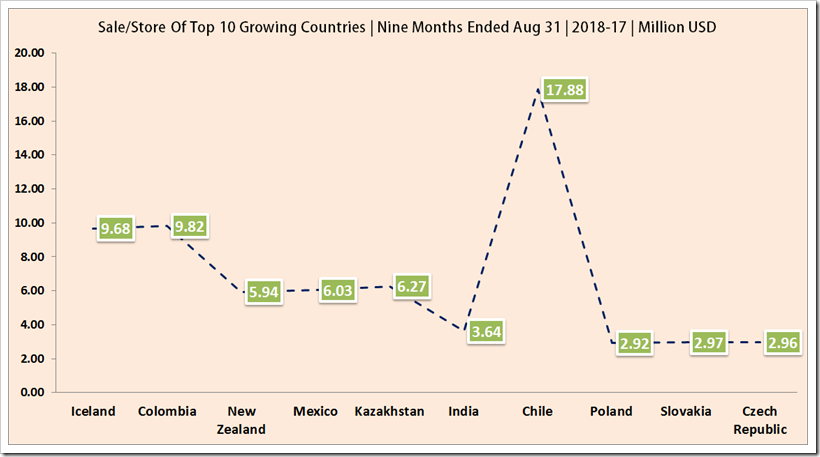
Top 10 Growing Countries Based On Sales Of The First Nine Months Ended On August 31,2018
If we look from the following data, we will find that Mexico is the country with a reasonable number of stores and a very good per store sale of about $ 6 million million . This puts Mexico in the hot seat when we consider the last 9 months. Next comes India with 29% growth and reasonable number of stores. Growth in Poland of 21% with 182 stores also can be considered very good.
|
Regions |
2018 (SEK M) |
2017 (SEK M) |
2018 (USD M) |
2017 (USD M) |
Change in % |
31 Aug – 18 No Of Stores |
Sale/Store |
|
Iceland |
176 |
13 |
19.36 |
1.43 |
1254% |
2 |
9.68 |
|
Colombia |
357 |
129 |
39.27 |
3.74 |
177% |
4 |
9.82 |
|
New Zealand |
216 |
129 |
23.76 |
10.01 |
67% |
4 |
5.94 |
|
Mexico |
2358 |
1670 |
259.38 |
31.68 |
41% |
43 |
6.03 |
|
Kazakhstan |
171 |
121 |
18.81 |
66.88 |
41% |
3 |
6.27 |
|
India |
1124 |
874 |
123.64 |
159.94 |
29% |
34 |
3.64 |
|
Chile |
1300 |
1060 |
143 |
34.54 |
23% |
8 |
17.88 |
|
Poland |
4826 |
3995 |
530.86 |
32.01 |
21% |
182 |
2.92 |
|
Slovakia |
648 |
538 |
71.28 |
20.9 |
20% |
24 |
2.97 |
|
Czech Republic |
1399 |
1177 |
153.89 |
292.6 |
19% |
52 |
2.96 |
Five Year Sales Summary on Nine Month Basis | December – August | 2014-2018
Looking out the results of Nine Months of previous five years , we can immediately draw this conclusion that , though the sales have been growing, however the pace of growth is inconsistent . In 2015 , the growth rate was 21% which came down to the level of 5% in 2016 , in 2017 it shown an upward trend with growth rate of 7% however in the latest Nine Months ended results , the results are down by 4% and hence the growth rate remained only 3% .
|
Year |
SEK (M) |
USD (M) |
% Change |
|
2014 |
126,964 |
13,966 |
– |
|
2015 |
153,444 |
16,879 |
21% |
|
2016 |
161,767 |
17,794 |
5% |
|
2017 |
173,290 |
19,062 |
7% |
|
2018 |
178,817 |
19,670 |
3% |
The path is not going to be so easy for the H&M, the Swedish group that is the world’s second-largest clothes retailer by sales. The retailer is facing competition not just from cheaper fashion brands such as Primark but above all internet sellers such as Zalando, Asos and Amazon. Its closest competitor Zara has been doing very well in online sales and so H&M . The retailers need to do a lot to make supply chain little quicker. Not to forget , Zara delivers the products within a day time via its online sales in many countries.


