Gap Inc, one of the most reputed global apparel retailer , has released its financials for the second quarter of 2017. In this report , we analysed in detail revenues & profits of their brands : Gap Global , Old Navy and Bananna Republic . There is also an analysis on the geographical distribution of the revenue and profit of their respective brands for April – June’17 compared to same period in 2016.
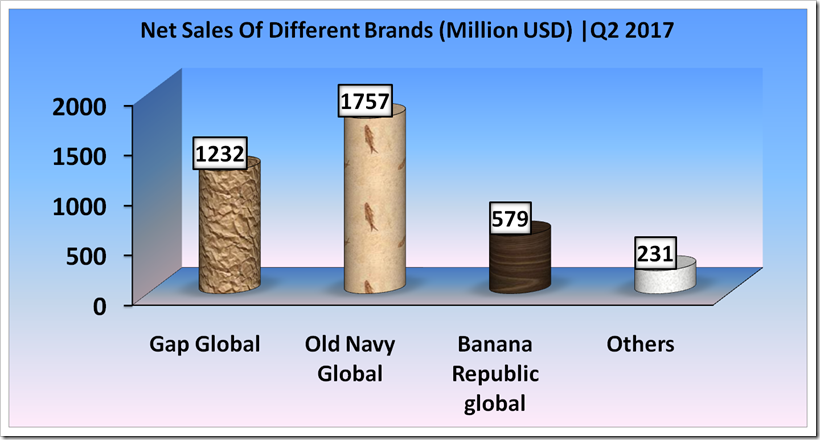
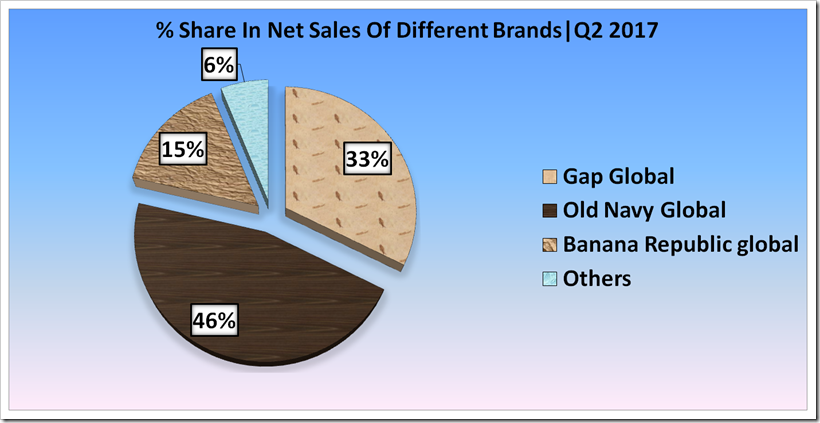
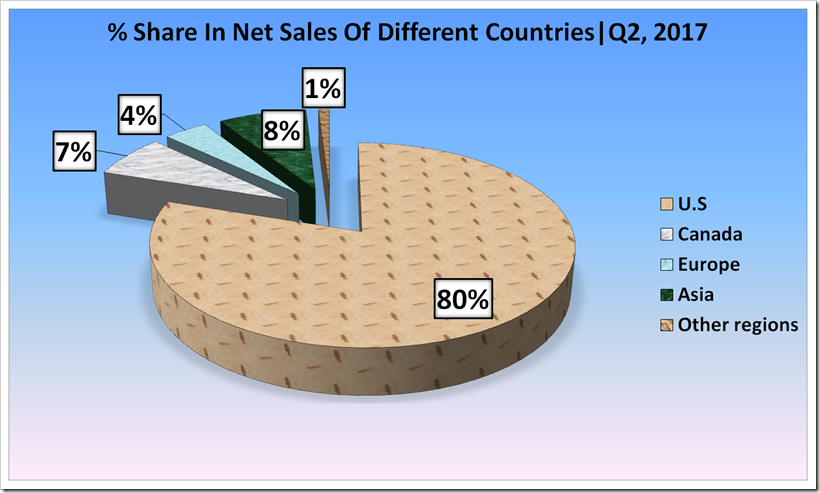
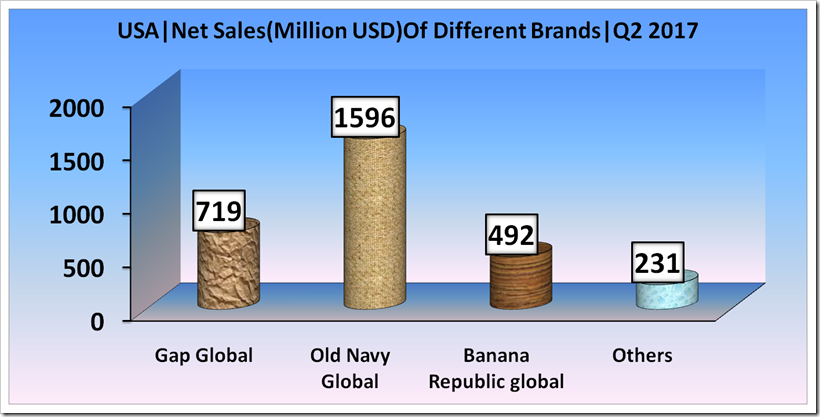
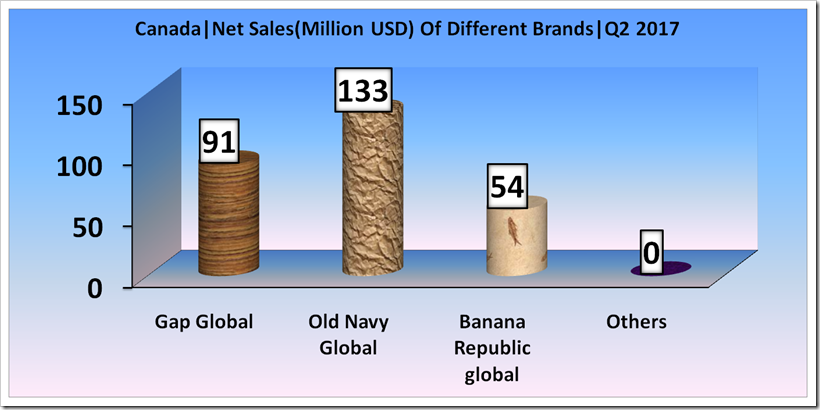
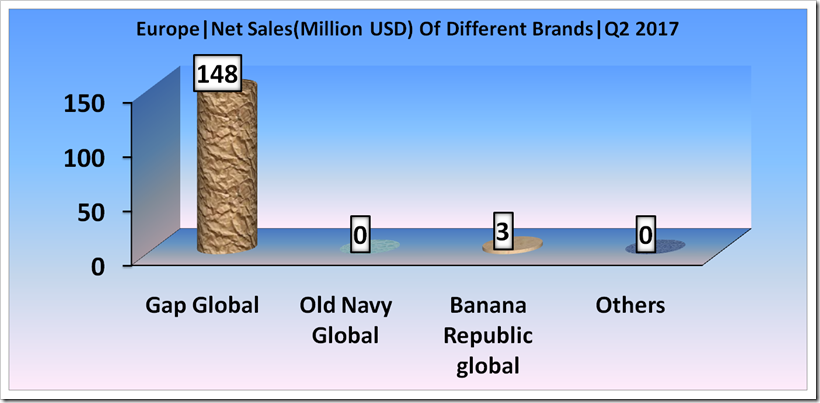
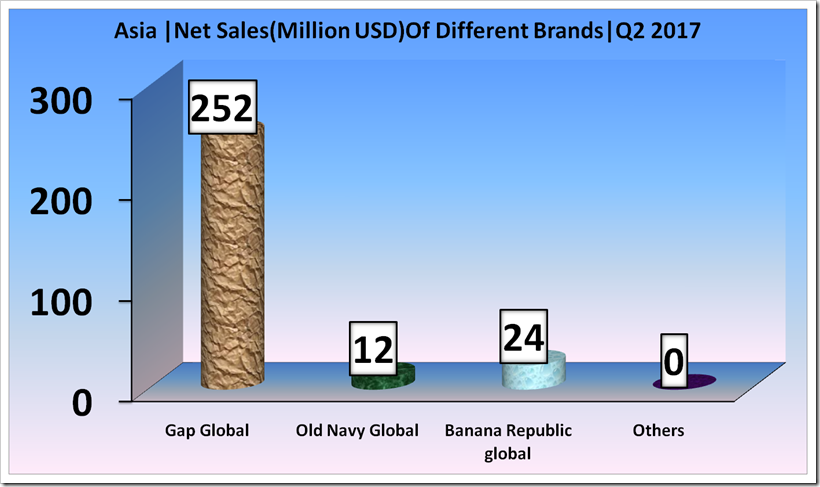
The table below shows the net Sales of The Gap Inc, for 2nd quarter 2017 (Million USD) – USD 1,232 Million , Similarly for Old Navy Global it is USD 1,757 Million , for Banana Republic Global it is USD 579 Million . Out of total revenue of USD 3,799 Million , USA has a share of over 80% on the whole and Europe has merely a share of 4% in net sales. Except GAP Global, no other brand has serious presence in Asia for the retailer.
*(Figures- In Million USD)
|
Particulars |
Gap Global |
Old Navy Global |
Banana Republic global |
Others |
Total |
Percentage of Net Sales |
|
U.S |
719 |
1596 |
492 |
231 |
3038 |
80 |
|
Canada |
91 |
133 |
54 |
0 |
278 |
7 |
|
Europe |
148 |
0 |
3 |
0 |
151 |
4 |
|
Asia |
252 |
12 |
24 |
0 |
288 |
8 |
|
Other regions |
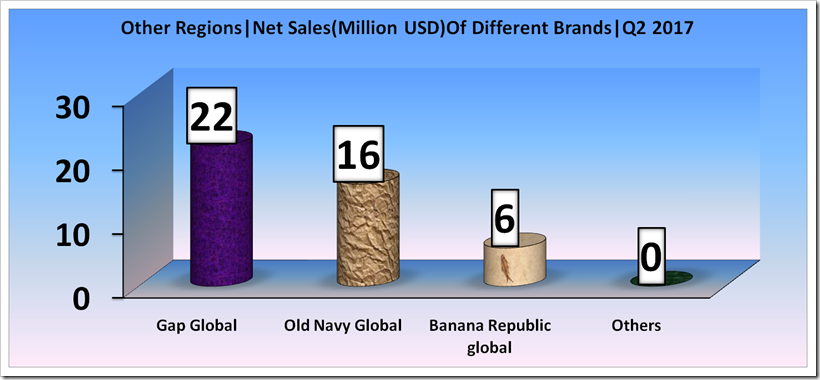
22 |
16 |
6 |
0 |
44 |
1 |
|
Total |
1232 |
1757 |
579 |
231 |
3799 |
100 |
Geographical Distributions Of Revenue Of Different Brands
1. Gap Global
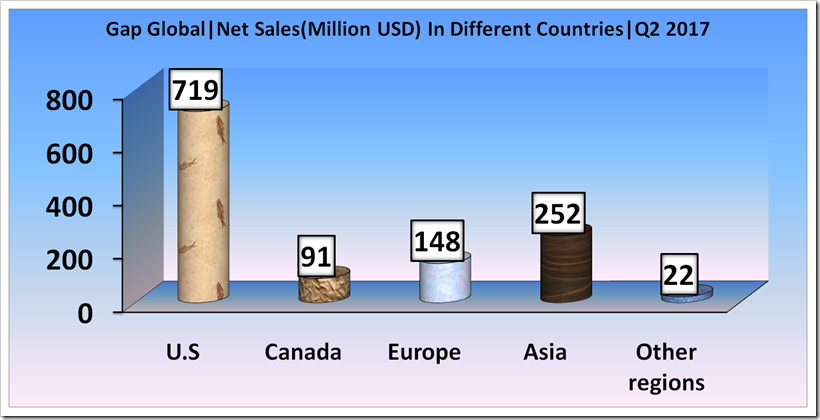
The net sales of Gap Global in U.S is USD 1232 million in second quarter . USA contributes about 60% , Canada 8% , Europe about 12%, Asia 20% of net sales .
2.Old Navy Global
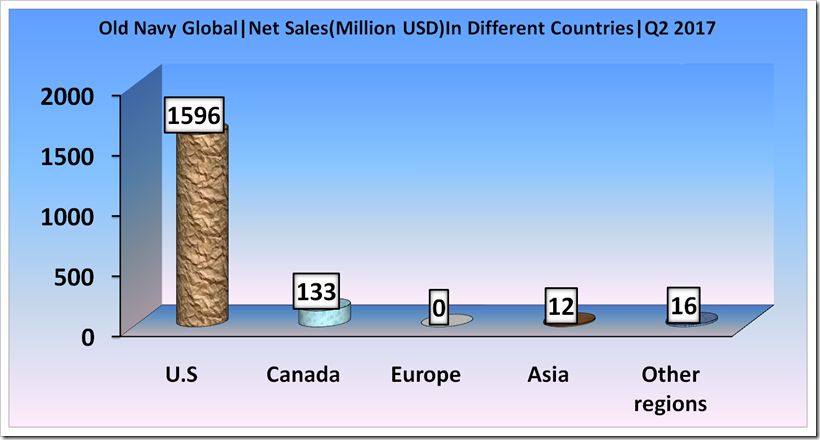
The graph shows the net sales (Million USD) in second quarter,2017 in different regions for Old Navy Global. U.S shows a net sales of 1,596 (Million USD) and is almost entirely achieved in US with a small contribution coming from Canada of USD 133 . Asia contributes a net sales of mere USD 12 million and Other regions contribute a net sales of 16 (Million USD). Europe doesn’t have any share in the revenue distribution of Old Navy Global for Q2 2017 .
3.Banana Republic Global
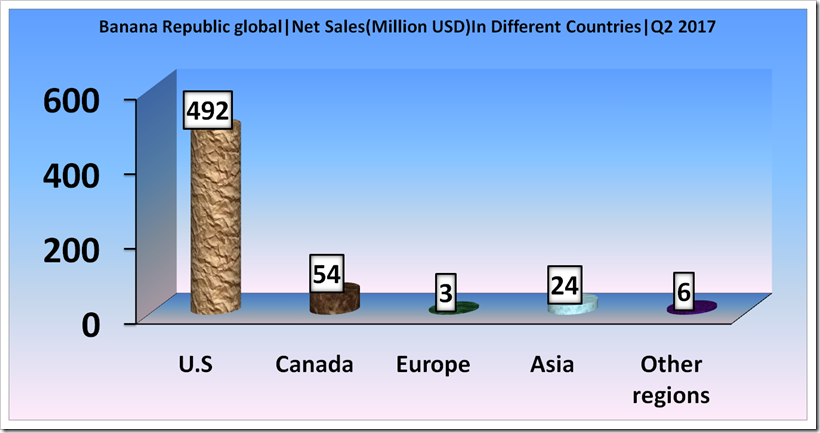
The graph shows the net sales (Million USD) in second quarter, 2017 in different countries for Banana Republic Global . U. S contributes the major portion of over 80% and balance is just some contribution from Canada and miniscule quantities in Asia.
Revenue Distribution Of Brands In Different Regions
1. USA
2.Canada
3.Europe
4.Asia
5. Other Regions
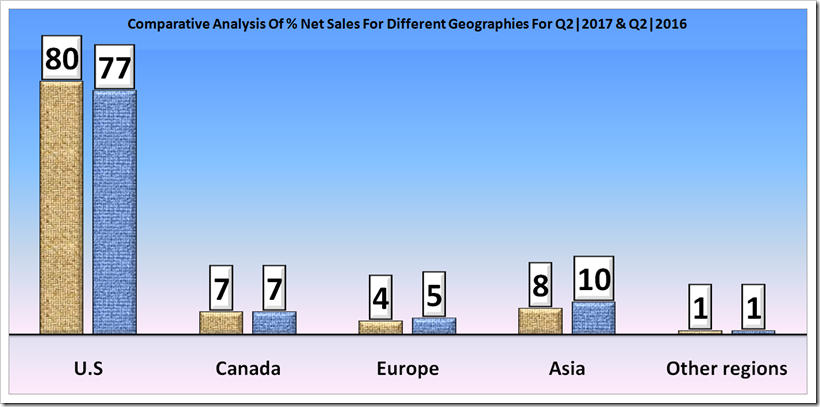
Comparative Analysis In % For Geographical Distribution Of Net Sales For Q2’17 and Q2’16
The comparative study gives many surprising statistics about the ups and downs of Gap revenue coverage over different regions. Sales in USA have growin by 3% however the Asia sales are down 2% and the reason could be the inability of the retailer to fight against retailers like H&M and Zara which are cutting down their prices to take over the shares of their competitors. The equations have been changed over the years and for the retailers of mid range denim , the market has become pretty difficult due to change in consumer behavior . Recently , H&M achieved the sales of USD 120 million in India within 6 months of starting operations and that too with handful stores which is very encouraging however it sets the balls on rolling for such markets. It seems that GAP is not currently geared up to perform in any other market except the US and this is perhaps the reason for its almost static sales. The company will have to devise strategies to be present in a stronger way in these markets as most of the growth is happening in Asia and GAP is currently kind of lost in these markets.
|
Particulars |
Percentage of Net Sales (Q2|2017) |
Percentage of Net Sales (Q2|2016) |
|
U.S |
80 |
77 |
|
Canada |
7 |
7 |
|
Europe |
4 |
5 |
|
Asia |
8 |
10 |
|
Other regions |
1 |
1 |
|
Total |
100 |
100 |
Comparative Analysis Of Revenue Distribution Of Different Brands For Q2’17 and Q2’16
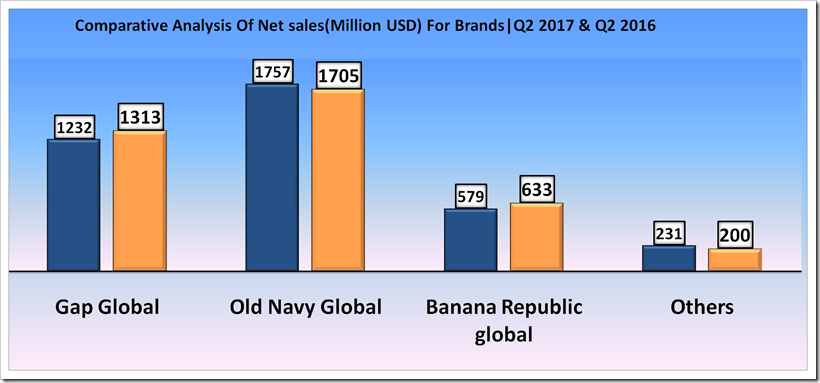
Gap Global as a brand has lost its share in the GAP INC if we compare with the Q2, 2016 . In Q2, 2016 , the net sales were USD 1,313 million which came down to USD 1,232 in Q1’17. Old Navy has some positive changes from USD 1,705 million to USD 1,757 million in Q2’17 . Banana Republic also lost its share marginally from USD 633 million in 2016 to USD 579 million in 2017 . On the whole it was a almost static sales but the good news is that Gap sales did not fall significantly.
|
Particulars |
Net Sales|Million USD|(Q2|2017) |
Net Sales|Million USD|(Q2|2016) |
|
Gap Global |
1,232 |
1,313 |
|
Old Navy Global |
1,757 |
1,705 |
|
Banana Republic global |
579 |
633 |
|
Others |
231 |
200 |
|
Total |
3,799 |
3,851 |
Table Showing Store count, openings, closings for Q2,2017
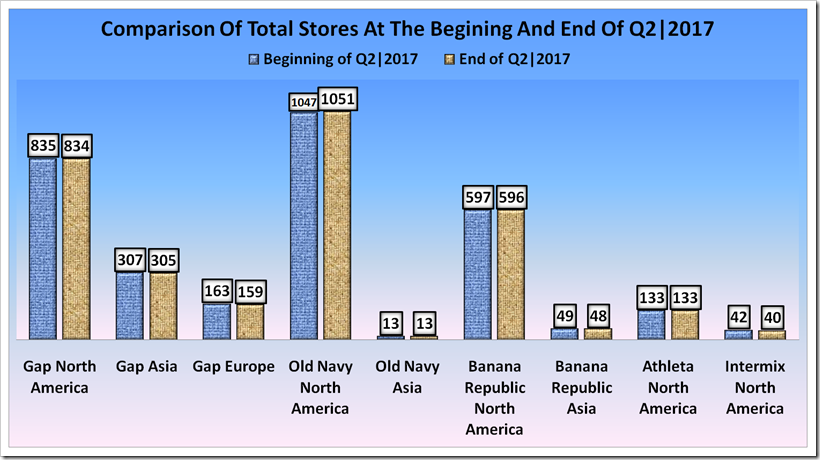
Within a span of 13 weeks , the company has closed 22 of its stores worldwide however opened only 15 with a net reduction in number of stores . Old Navy North America seems to be growing as they have 8 new stores while 4 stores which has been closed during this quarter . With a Total stores of 3186 in the beginning of Q2 ,17 , the company is left with 3179 stores at the end of the quarter which includes 22 closer and 15 new additions to fleet .
|
Particulars |
Beginning of Q2|2017 |
Opened |
Closed |
End of Q2|2017 |
|
Gap North America |
835 |
3 |
4 |
834 |
|
Gap Asia |
307 |
1 |
3 |
305 |
|
Gap Europe |
163 |
0 |
4 |
159 |
|
Old Navy North America |
1,047 |
8 |
4 |
1051 |
|
Old Navy Asia |
13 |
0 |
0 |
13 |
|
Banana Republic North America |
597 |
3 |
4 |
596 |
|
Banana Republic Asia |
49 |
0 |
1 |
48 |
|
Athleta North America |
133 |
0 |
0 |
133 |
|
Intermix North America |
42 |
0 |
2 |
40 |
GAP and many such retailers in mid priced segments need to revamp their strategies to fight the onslaught of fast retailers and fast fashion. These retailers are losing the race with the more nimble footed ones who are giving cheaper products with reasonable quality. To survive, they need to innovate. Here it is also important to note the competition is not only from H&Ms and Zaras but also from Online retailers like Amazon who are turning new leaves in the chapter of fashion evolution with new technologies like Artificial Intelligence. The challenges are many and those who preempt them will survive and grow !


