Gap Inc. shows a strong performance in difficult times with sales up by 1 percent . In times when brick and mortar stores are finding it difficult to sustain and many have closed, there is some vaccum left which is being filled in by retailers like Gap . Though the performance cannot be termed great but it seems quite good when compared with most other retailers. The driving force has been Old Navy.
-
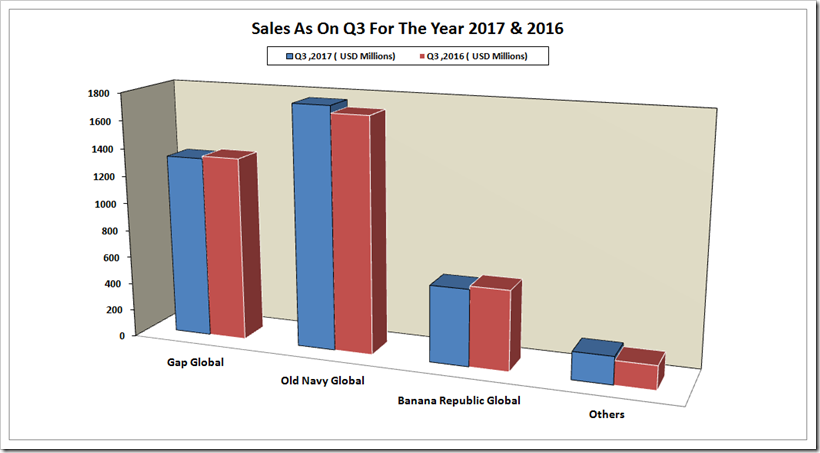
Old Navy Global: Positive 3 percent growth compared from last year.
-
Gap Global: Negative 1 percent growth compared from last year
-
Banana Republic Global: Negative 1 percent growth compared from last year.
Net Sales Results
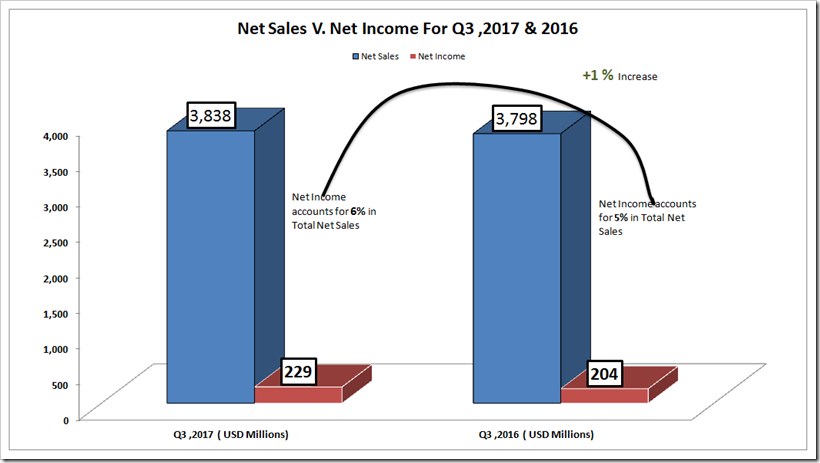
Net sales for the third quarter of fiscal year 2017 were $3.84 billion compared with $3.80 billion for the third quarter of fiscal year 2016. Third quarter net sales details appear in the tables . There is an increase in Net Sales by 1% from the last year however if we compare the figure of sales for the 9 months , we realized that there is decline in Net Sales i.e, from $11.08 billion to $11.07 billion . The Net Sales – Net Profit seems more encouraging as it has increased from 5% to 6%.
Revenue From Brands In Different Regions
Looking at the brand’s revenue distributions in different regions , we noticed that USA lost its share in sales for Gap Global And Banana Republic Global however For Old Navy And Other Brands increased their share in USA region. Canada performed very well in all brand segments as it didn’t lose share in sales for any brand for the Q3,2017 . Asian region is the biggest disappointment for the Q3 as in all brand segments , it lost its share substantially. Where the brands like H&M and Zara have been performing so well in Asian Market , it is strange to see the diminishing position of GAP . Probably , its mid segment placement is the problem.
| In USD Millions | ||||||||||
|
13 Weeks Ended October 28, 2017 & 2016 |
Gap Global
2017 2016 |
Old Navy Global
2017 2016 |
Banana Rep. Global
2017 2016 |
Others(2)
2017 2016 |
Total
2017 2016 |
|||||
|
U.S. |
750 |
756 |
1,587 | 1,507 | 467 | 479 | 200 | 172 |
3,004 |
2,914 |
|
Canada |
109 |
102 | 143 | 131 | 57 | 55 | 1 | 1 |
310 |
289 |
|
Europe |
154 |
150 | – | – | 4 | 14 | – | – |
158 |
164 |
|
Asia |
278 |
296 | 13 | 55 | 21 | 25 | – | – |
312 |
376 |
|
Other regions |
31 |
36 | 15 | 12 | 8 | 7 | – | – |
54 |
55 |
|
Total |
1,322 |
1340 |
1,758 | 1,705 | 557 | 580 | 201 | 173 | 3,838 | 3,798 |
Region Wise Sales
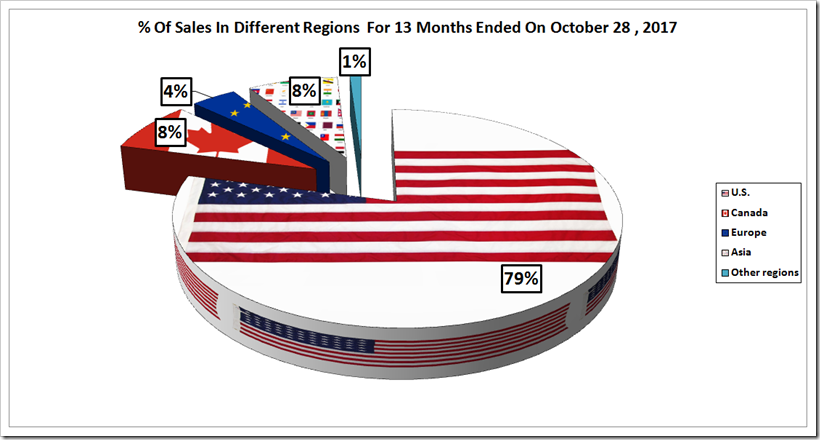
So far as the % of sales from different regions are concerned , US contributed 79% of sales which is 2% more that the last year . All the other regions excluding Asia remained constant in terms of sales in Q3 . Asia lost the share in the total sales by 2% and the reason might be the stiff competition from the rival brands like H&M.
| Region Of Sales | 13 Weeks Ended October 28, 2017 | % Of Net Sales | 13 Weeks Ended October 29, 2016 |% Of Net Sales | ||
|
U.S. |
79 |
77 |
||
|
Canada |
8 |
8 |
||
|
Europe |
4 |
4 |
||
|
Asia |
8 |
10 |
||
|
Other regions |
1 |
1 |
||
|
Total |
100 | 100 | ||
Store Count on Beginning of Q3 and At the End Of Q3
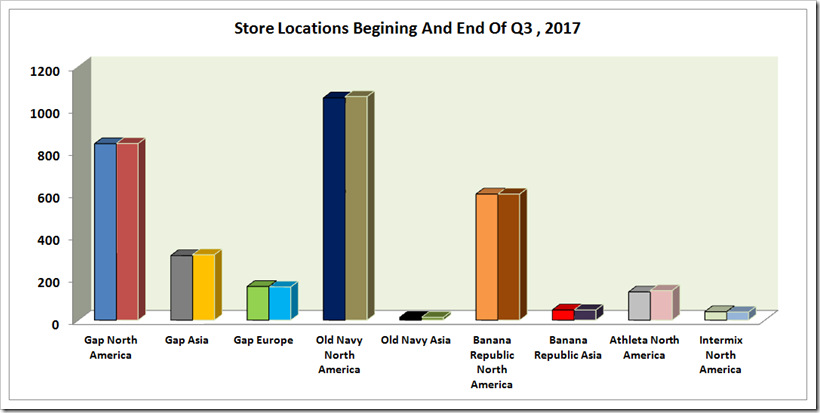
The company ended the third quarter of fiscal year 2017 with 3,639 store locations in 46 countries, of which 3,193 were company-operated. The company now expects to close about 30 company-operated stores, net of openings and repositions.
| 13 Weeks Ended October 28, 2017 | ||
| Region/Brand | Store Locations | Store Locations |
| Beginning of Q3 | End of Q3 | |
| Gap North America | 834 | 835 |
| Gap Asia | 305 | 309 |
| Gap Europe | 159 | 157 |
| Old Navy North America | 1,051 | 1,057 |
| Old Navy Asia | 13 | 13 |
| Banana Republic North America | 596 | 596 |
| Banana Republic Asia | 48 | 48 |
| Athleta North America | 133 | 140 |
| Intermix North America | 40 | 38 |
| Company-operated stores total | 3,179 | 3,193 |
| Franchise | 463 | 446 |
| Total | 3,642 | 3,639 |
Segments
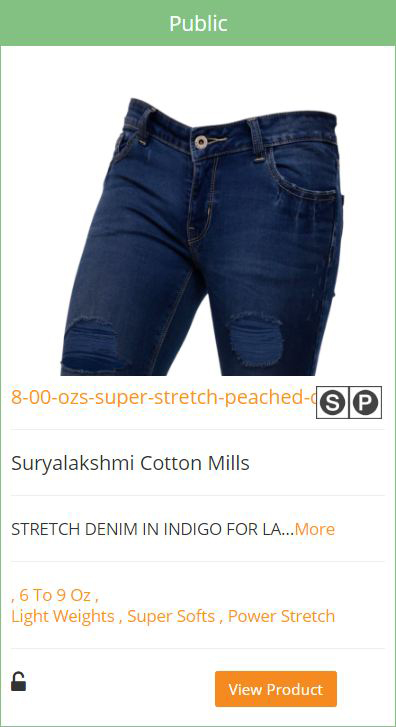
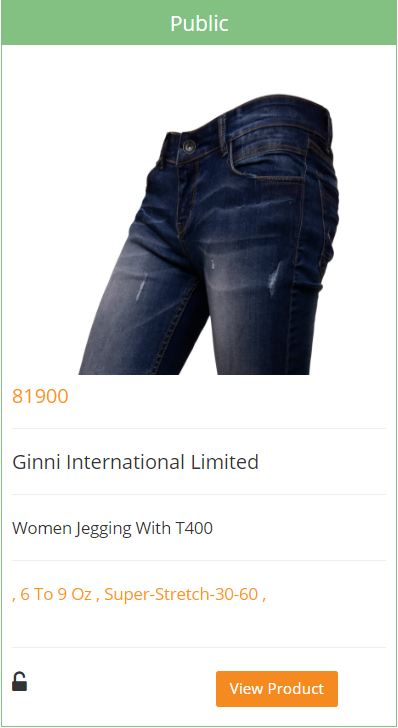
Denim seems to be strong with particular strength in women’s denim which grew over 13% as an individual segment. Old Navy is now among top 5 value denim retailers in the US and going strong based on its product and value pricing which shows that brick and mortar stores are able to draw the consumers based on pricing. Activewear has been the strongest growth driver contributing over $1 billion in revenues. Athleta – the activwear brand of GAP – is witnessing strong growth. As per NPD, the size of Athleisure market in US is a huge $44 billion and increasing 10% each year. Hence this segment opens big opportunites for GAP and other retailers. Improved sales in Women’s denim is also a reflection of this trend as many styles of women’s denim have athleisure features.
Gap is also taking E-commerce seriously. It has been investing in developing online business and is targeting over $3 billion in sales in coming years. To this end it is trying to integrate its Offline and Online offerings with online facilities like “Reserve in Store, Pick up in store , Ship from Store ” etc. The idea is to give pure ecommerce companies a run for their money by providing dual service to the consumers .


