VF has come out with very encouraging results for the fourth quarter of 2017 showing a growth of 20% to reach a turnover of about USD 3.64 billion. The group has been facing tough times with some of its segments like Jeanswear while others like Outdoor & Action Sports have been shining. The group performs well as a whole but leaves a lot to be desired in some segments.
1. Revenues For The Fourth Quarter
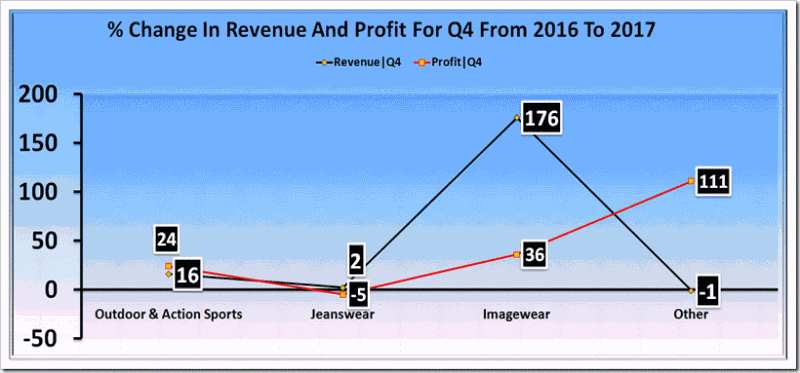
The revenues for the different segments for the fourth quarter from 2016 to fourth quarter 2017 saw that the total revenues changed positively by 20% . The revenues in fourth quarter for Outdoor & Actions Sports increased by 16% from about $2.16 billion in 2016 to $2.50 billion in fourth quarter 2017. The revenues for Jeanswear did not increase much and showed only a growth of about 2%. However, Image wear segment saw a substantial growth in revenue of a huge 176% in fourth quarter 2017 to reach a turnover of about $406 million usd.
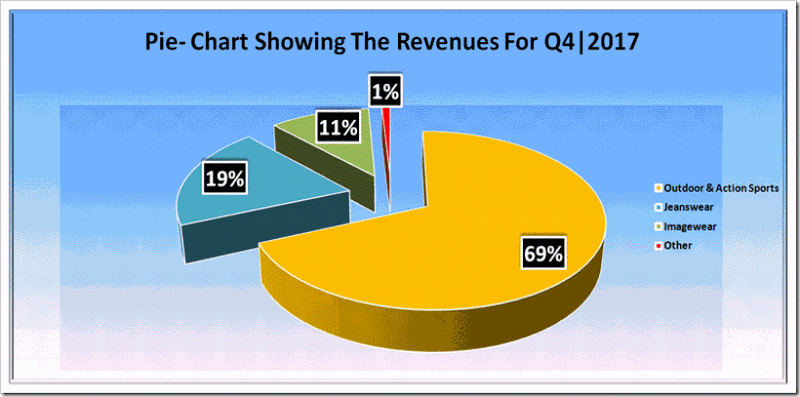
Outdoor & Action sports is now the mainstay of VF with about 69% of total turnover while Jeanswear is lagging at 19% only and the rest is divided among different segments.
| Coalition Revenues | Q4|2017 (‘000 $) | Q4|2016(‘000 $) | % Change |
| Outdoor & Action Sports | 2,500,203 | 2,160,310 | 16 |
| Jeanswear | 709,411 | 696,515 | 2 |
| Imagewear | 406,356 | 147,175 | 176 |
| Other | 333,13 | 335,43 | -1 |
| Total coalition revenues | 3,649,283 | 3,037,543 | 20 |
2. Revenue For Full Year
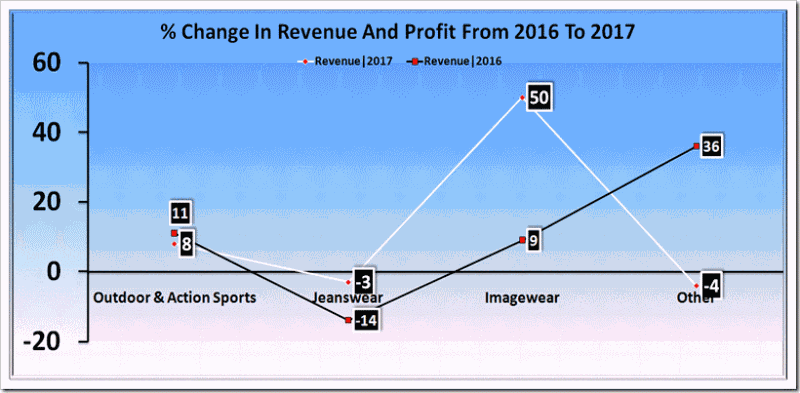
The revenue in different segments for the full year of 2017 show that major action is happening in Imagewear only which has shown 50% growth. Jeanswear is where mid priced retailers like VF are struggling and not able to compete with fast fashion retailers like H&M. The company has shown negative growth of 3% for Jeanswear for the whole year while Outdoor and Action Sports segment has shown a healthy growth of 8% to reach a total turnover of about 11.8 billion USD for the whole year . The overall top line growth has been 7% in 2017.
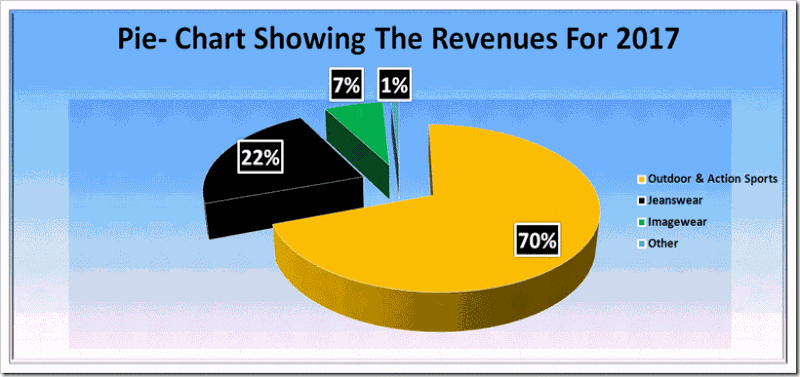
The pie – chart saw that the revenues for the full year of 2017 for the different segments like Outdoor & Action Sports was 70% of the total revenue , Similarly the revenues for Jeanswear, Imagewear and Other were 22%, 7% and 1% respectively for the full year of 2017.
| Coalition Revenues | 2017 (‘000 $) | 2016 (‘000 $) | % Change |
| Outdoor & Action Sports | 8,212,456 | 7,618,564 | 8 |
| Jeanswear | 2,655,361 | 2,737,701 | -3 |
| Imagewear | 830,215 | 551,808 | 50 |
| Other | 113,145 | 118,704 | -4 |
| Total coalition revenues | 11,813,194 | 11,028,793 | 7 |
3. Profit/Loss
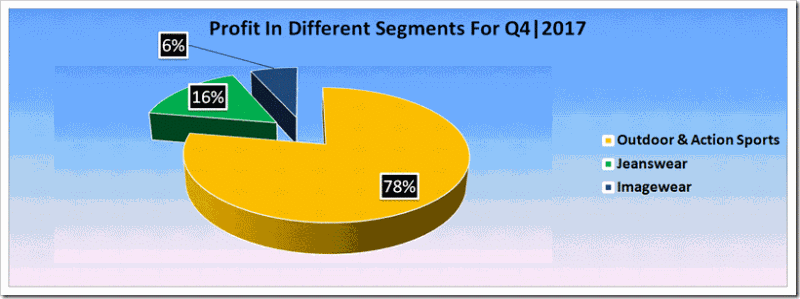
The pie – chart saw that the profit for the fourth quarter of 2017 like Outdoor & Action Sports was 78% of the total revenue , similarly the Jeanswear, Imagewear was 16% and 6% of the total revenue. This again clearly shows that VF is now more of a Outdoor & Action Sports company than a Jeans company.
| Coaliation Profit/Loss | Q4|2017 (‘000 $) | Q4|2016 (‘000 $) | % Change |
| Outdoor & Action Sports | 486,303 | 391,139 | 24 |
| Jeanswear | 97,950 | 103,348 | -5 |
| Imagewear | 40,903 | 30,112 | 36 |
| Other | 139 | -1295 | 111 |
| Total coaliation profit | 625,295 | 523,304 | 19 |
4.Profit/Loss
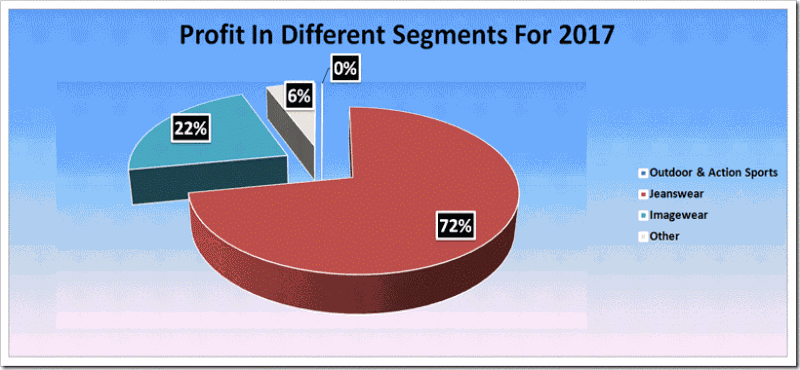
The total profit , however, did not increase in the same volume as that of fourth quarter. The profit increased in total by 4% only . These profits were dragged down by the Jeanswear segment which reduced its profit by 14% . The pie- chart saw that the profit for different segment in 2017 like Outdoor & Action Sports was 22% of the total revenue , similarly for Jeanswear, Imagewear was 72% and 6% of the total revenue of 2017.
| Coaliation Profit/Loss | 2017 (‘000 $) | 2016 (‘000 $) | % Change |
| Outdoor & Action Sports | 1,378,294 | 1,243,201 | 11 |
| Jeanswear | 421,945 | 491,912 | -14 |
| Imagewear | 113,252 | 104,203 | 9 |
| Other | -3086 | -4817 | 36 |
| Total coaliation profit | 1,910,405 | 1,834319 | 4 |
5.Geographic Revenue Growth
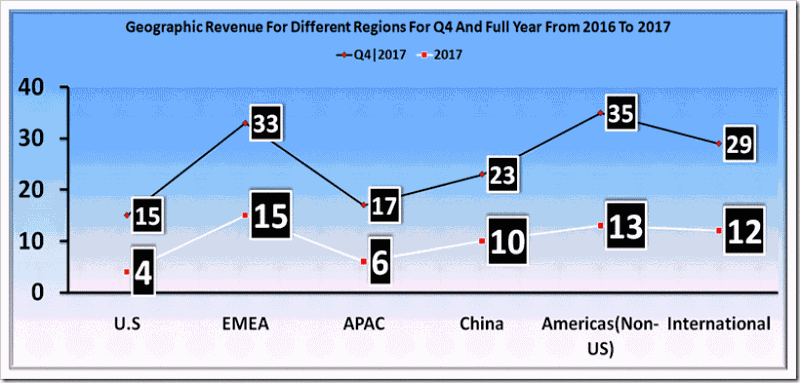
The Percentage change in revenue for fourth quarter of 2017 from the same period in last year , saw that the revenue growth for U.S increased by 15% , Similarly the revenue growth in EMEA, APAC, China , Americas and Internatianal increased by 33%, 17%, 23%, 35%, respectively for the fourth quarter of 2017. However the geographic revenue growth for the year 2017 in U.S was 4% , similarly for APAC, China, Americas(Non- US) and Internationally was 15% , 6% ,10%, 13% ,12% respectively.It is also to be seen that the maximum revenue growth was in EMEA and Americas(non U.S) for both fourth quarter and full year of 2017.
| Geographic Revenue Growth | Q4|2017 (%) | 2017 (%) |
| U.S | 15 | 4 |
| EMEA | 33 | 15 |
| APAC (Asia – Pacific) | 17 | 6 |
| China | 23 | 10 |
| Americas (Non- US) | 35 | 13 |
| International | 29 | 12 |
6. Channel Revenue Growth
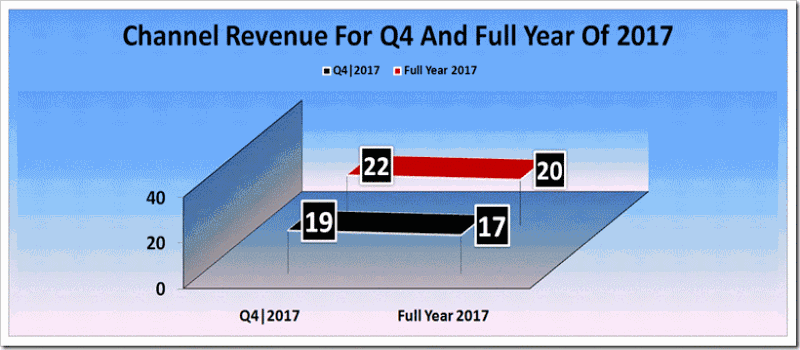
The channel revenue growth for Wholesale Channel and Direct – to – consumer channel for fourth quarter of 2017 increased about 19% and 22% from the last year of the same period and that of the full year was 17% and 20% respectively.
| Channel Revenue Growth | Q4|2017 (%) | Full Year 2017 (%) |
| Wholesale | 19 | 17 |
| Direct – to – consumer | 22 | 20 |


